
Sanity Checks for Customer Experience: Understanding CSAT, NPS, eNPS & CES
Sanity Checks for Customer Experience: Understanding CSAT, NPS, eNPS and CES
Customer experience is ultimately about how your customers and employees feel when they interact with your brand. Surveys are one of the most reliable ways to understand those feelings, but the sheer number of metrics can be confusing.
This guide gives you a clear breakdown of the four most widely used CX surveys: CSAT, NPS, eNPS and CES. You will know what each one measures, when to use it, and how to act on the results.
——————————————————————————————————————
Why Measure Customer Experience?
When customers buy from you, interact with support, or use your product, they form opinions that directly affect retention and revenue.
Surveys collect that feedback while it is still fresh. They can cover website usability, delivery, product quality, and how customers found you in the first place. When used consistently, they become one of the most reliable tools for continuous improvement.
——————————————————————————————————————
What Is a Customer Satisfaction Survey?
A customer satisfaction survey asks people to rate how satisfied they are with an interaction, product, or service. It can be as simple as a single question or a short set of rating-scale questions. CSAT, NPS and CES are all types of satisfaction surveys, but each one measures a different aspect of the experience.
——————————————————————————————————————
CSAT: Customer Satisfaction Score
What Is CSAT?
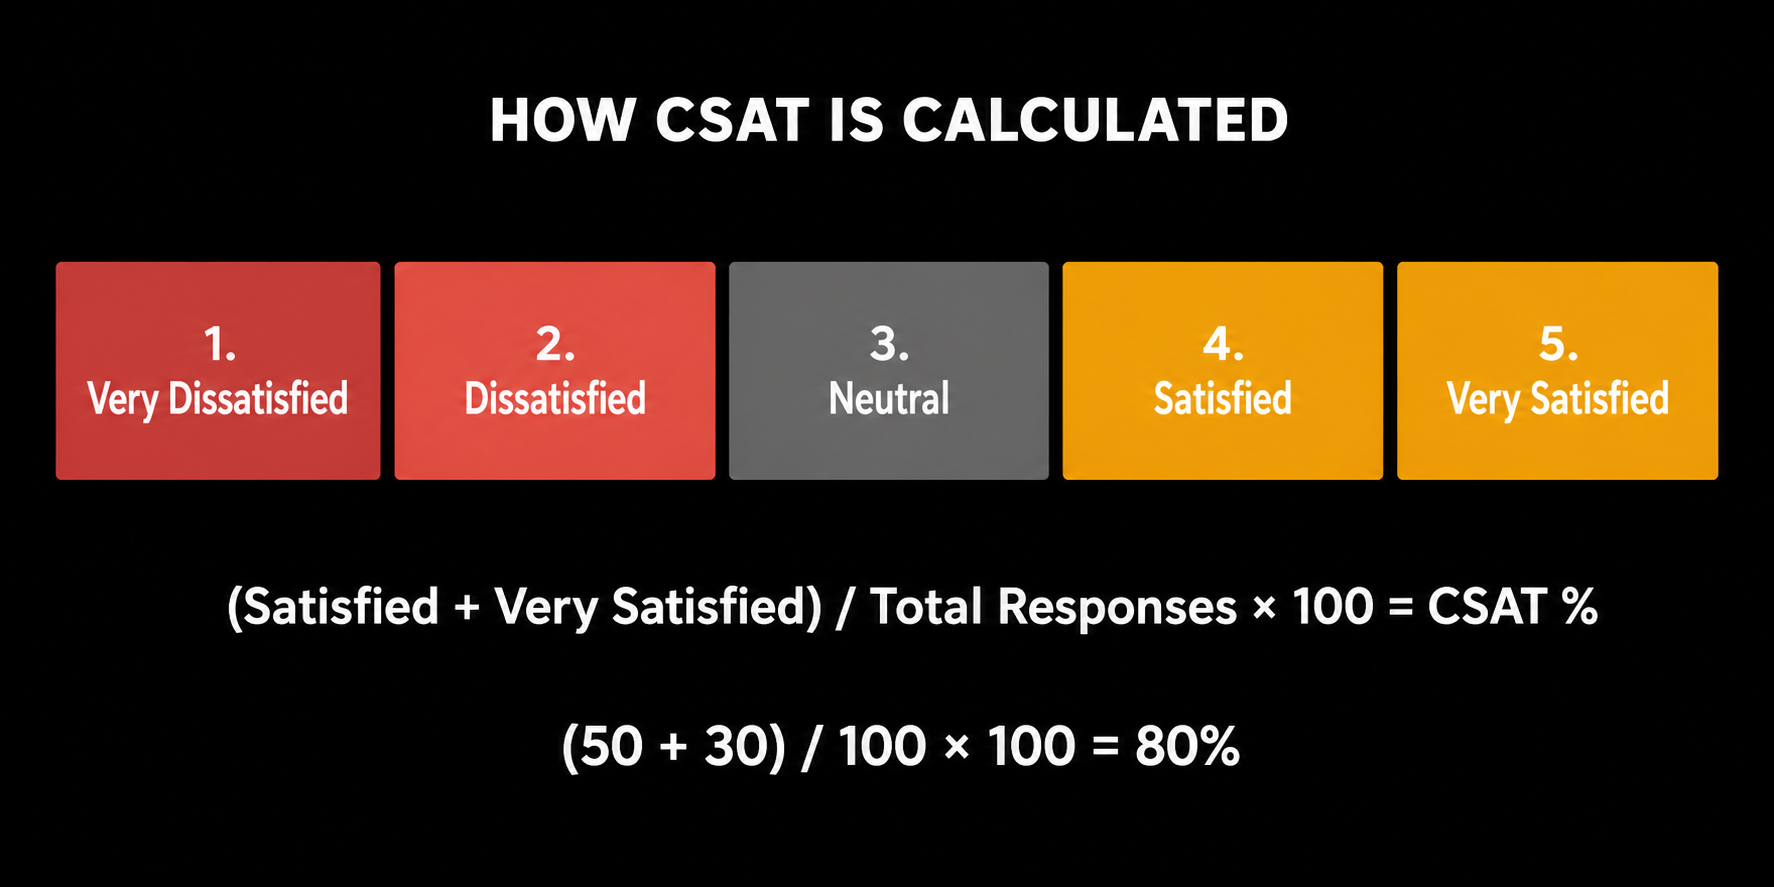
CSAT measures how satisfied your customers are after a specific interaction, purchase, or experience. Customers rate their satisfaction on a five-point scale, from "very dissatisfied" to "very satisfied." It is a short-term metric focused on whether customers are happy right now, rather than whether they will stay loyal.
How to Calculate CSAT
Count only the "Satisfied" and "Very Satisfied" responses. Divide that number by the total responses and multiply by 100.
CSAT (%) = (Satisfied + Very Satisfied responses) / (Total responses) x 100
For example, if you get 50 "Satisfied" and 30 "Very Satisfied" responses out of 100 total, your CSAT score is 80%.
When to Use CSAT
Use CSAT immediately after key moments like a purchase, a support interaction, or a product update. It tells you how customers feel about a specific touchpoint. Because it is transactional, you can track it frequently to see how changes affect satisfaction. Pair it with NPS and CES for a fuller picture.
What Is a Good CSAT Score?
Benchmarks vary by industry, but as a general guide:
- Above 85% — Excellent
- 75 to 85% — Good
- 60 to 75% — Average
Always compare against industry standards and track trends over time rather than chasing a single number.
Pros and Cons of CSAT
Pros: Short, easy to understand, and typically achieves high response rates. Ideal for quick check-ins after interactions.
Cons: Scores can fluctuate based on context. High scores do not guarantee long-term loyalty.
——————————————————————————————————————
NPS: Net Promoter Score
What Is NPS?
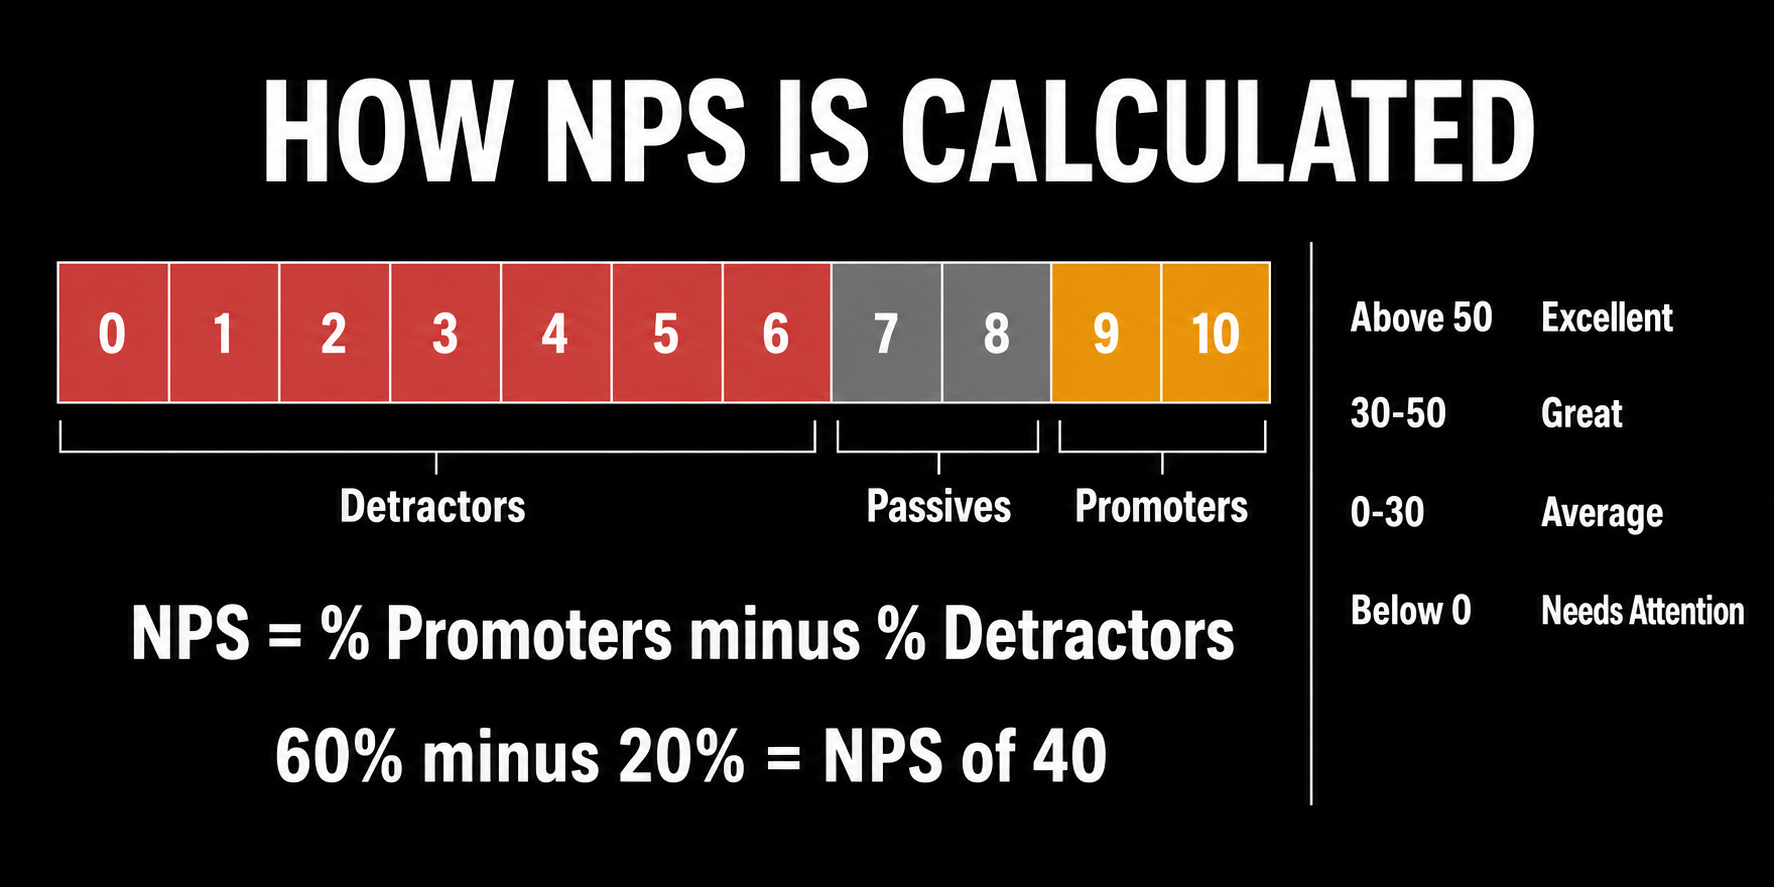
NPS measures how likely customers are to recommend your brand to friends or colleagues. Respondents rate their likelihood on a 0 to 10 scale and fall into three categories:
- Promoters (9 to 10) — enthusiastic fans who will likely recommend you
- Passives (7 to 8) — satisfied but unenthusiastic customers
- Detractors (0 to 6) — unhappy customers who may churn or leave negative feedback
How to Calculate NPS
NPS = % Promoters minus % Detractors
For example, if 60% of respondents are promoters and 20% are detractors, your NPS is 40. NPS values range from -100 to +100.
Score Interpretation
- Above 50 — Excellent
- 30 to 50 — Great
- 0 to 30 — Average
- Below 0 — Needs attention
When to Use NPS
NPS is a relationship metric. Use it monthly or quarterly to assess overall loyalty and long-term advocacy. Combine it with CSAT or CES for a fuller view of the customer journey.
Pros and Cons of NPS
Pros: Easy to communicate and widely benchmarked. Helps identify promoters who can fuel referrals and detractors who need outreach.
Cons: May overlook the large group of passives. NPS alone does not tell you why people feel the way they do. Follow-up questions are essential.
——————————————————————————————————————
eNPS: Employee Net Promoter Score
What Is eNPS?
eNPS adapts the NPS framework to measure employee sentiment. Employees answer one question: "How likely are you to recommend this company as a place to work?" The same 0 to 10 scale applies, with promoters (9 to 10), passives (7 to 8) and detractors (0 to 6).
How to Calculate eNPS
eNPS = % Promoters minus % Detractors
Passives are excluded from the calculation. For example, if 60% of employees are promoters and 15% are detractors, your eNPS is +45.
Score Interpretation
- 50 to 100 — Excellent
- 20 to 49 — Good
- 0 to 19 — Fair
- Below 0 — Poor
When to Use eNPS
Run eNPS quarterly or biannually. It works well during HR pulse checks, after major organisational changes, or at the end of onboarding. It is a leading indicator of culture and retention.
Pros and Cons of eNPS
Pros: Simple to run and benchmark. Helps identify pockets of engagement or concern within your workforce.
Cons: Excludes passive employees, so it gives a directional rather than complete view. Use qualitative follow-ups to understand the reasons behind the scores.
——————————————————————————————————————
CES: Customer Effort Score
Why Effort Matters
Research from a 2010 Harvard Business Review article found that effort, not delight, is the strongest predictor of customer loyalty. Customers with low-effort interactions are 94% more likely to repurchase, while 96% of customers who have high-effort experiences become disloyal. Making things easy drives retention.
What Is CES?
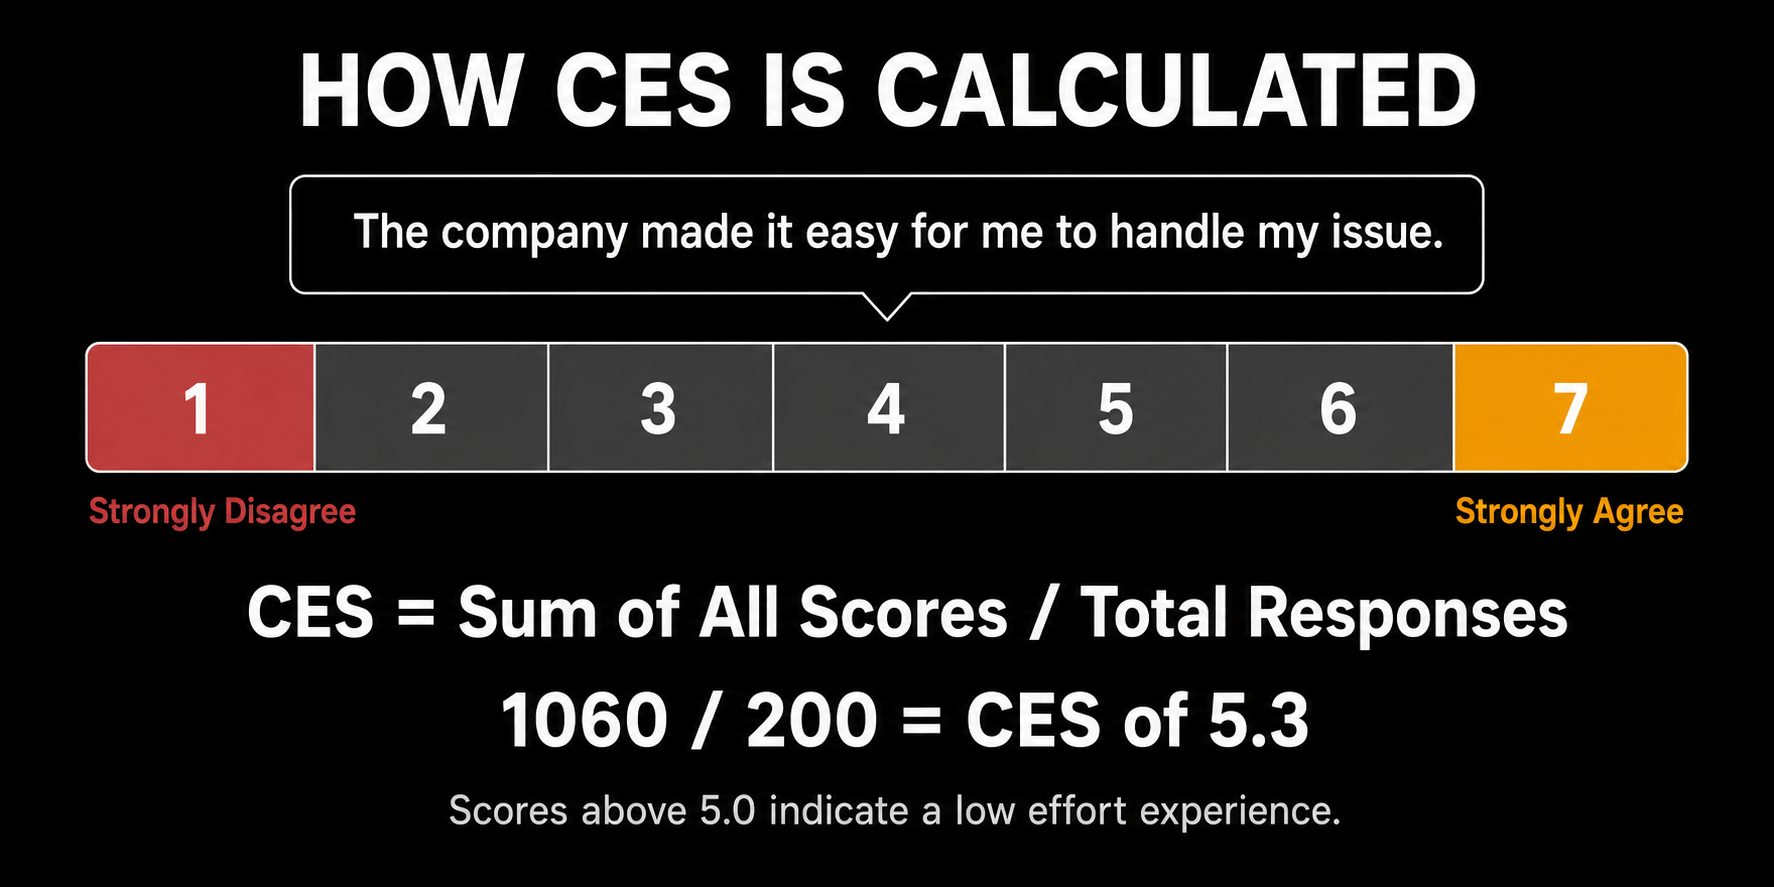
CES measures how easy it was for a customer to complete a task such as resolving a support issue, onboarding, or checking out. It uses a 1 to 7 agreement scale where 1 means "strongly disagree" and 7 means "strongly agree" that the company made it easy. Unlike CSAT, CES focuses on friction rather than happiness.
How to Calculate CES
CES = Sum of all scores / Total number of responses
For example, if 200 customers respond and the weighted sum of their scores is 1,060, the average CES is 5.3. Higher averages mean customers found the experience easy.
What Is a Good CES Score?
On a seven-point scale, averages above 5.0 generally indicate low effort and a positive experience. Track trends over time and look for improvements after removing friction points.
Pros and Cons of CES
Pros: Highly actionable. Identifies specific processes that need improvement. Research suggests it predicts retention better than satisfaction alone.
Cons: Narrow in scope. Only measures a specific touchpoint and does not capture overall sentiment. Use it alongside CSAT and NPS for a complete view.
——————————————————————————————————————
When to Use Each Survey
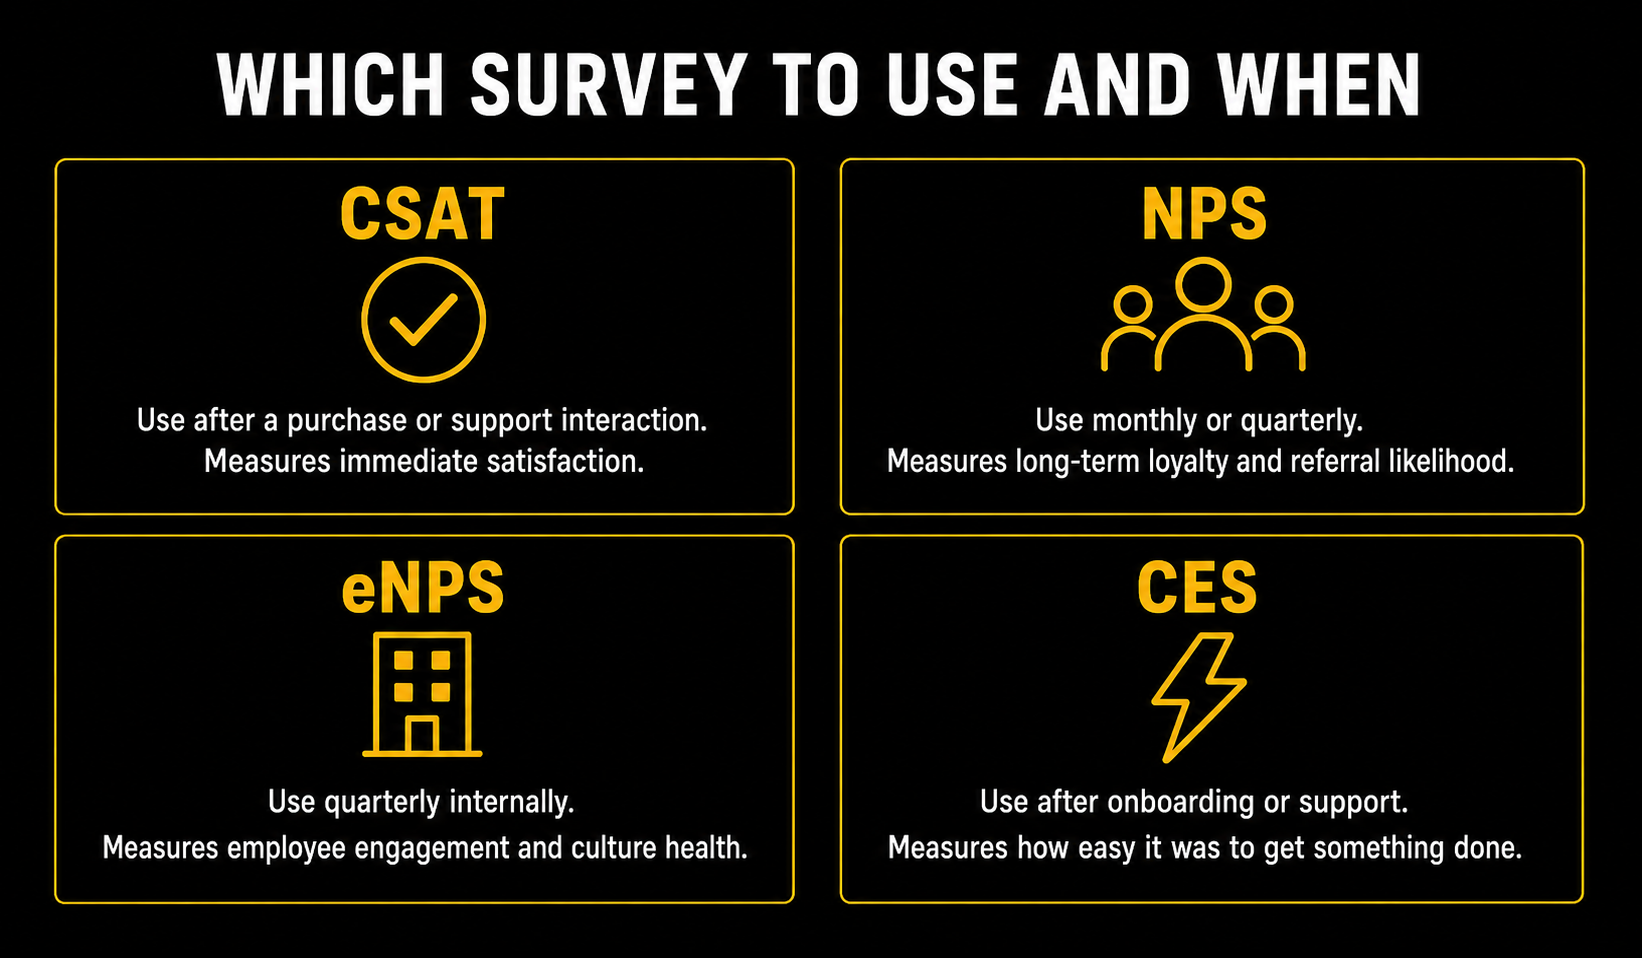
- Use CSAT after a transaction or interaction to gauge immediate satisfaction
- Use NPS periodically to assess overall loyalty and likelihood of referrals
- Use eNPS internally to monitor employee engagement and cultural health
- Use CES after support or onboarding to uncover friction and predict retention
Combining these metrics gives you a complete picture. CSAT measures satisfaction with a specific experience, NPS gauges long-term loyalty, and CES assesses how easy it was to get something done.
——————————————————————————————————————
Post-Purchase Surveys and Other Survey Types
Beyond these core metrics, post-purchase surveys give you a deeper understanding of what happens after the sale. Key areas to cover include satisfaction and brand loyalty, open-ended questions to capture reasons behind ratings, product and pricing feedback, usability issues, and delivery experience.
Send the survey on the thank-you page or via email a few days later to gather actionable feedback while the experience is still fresh.
——————————————————————————————————————
Best Practices for Surveys
Keep it short. One to two questions per touchpoint maximises response rates and reduces fatigue.
Use clear rating scales. Standardised scales make it easy to compare results over time.
Ask open-ended questions. Follow up rating questions with "Why?" to understand what is driving the scores.
Close the loop. Reach out to detractors and low scorers quickly to resolve issues before they churn.
Segment your feedback. Break down scores by customer type, product, or channel to find specific areas for improvement.
——————————————————————————————————————
Wrapping Up
CSAT tells you how satisfied customers are right now. NPS reveals whether they will recommend you. eNPS measures how your employees feel about working there. CES shows how easy it is to interact with your brand.
Each metric serves a distinct purpose. Together they give you a comprehensive view of the customer and employee experience. Measure consistently, act on what you find, and the results will follow.
——————————————————————————————————————
Running these surveys manually across channels gets complicated fast. Elvan helps teams set up CSAT, NPS, eNPS, CES and post-purchase surveys across email, web and Zendesk in minutes, without needing a developer. If you want feedback that is easy to collect and easier to act on, take a look at Elvan.
——————————————————————————————————————

Neil Roy
Content Strategist
Neil is a content strategist specializing in CSAT and NPS surveys, creating educational content that helps businesses understand and improve customer satisfaction. With 10+ years of experience, Neil writes insightful articles and develops content strategies that translate complex survey concepts into accessible, actionable guidance for organizations looking to enhance their customer relationships and business outcomes.