
PMF Surveys: How to Actually Measure Product-Market Fit
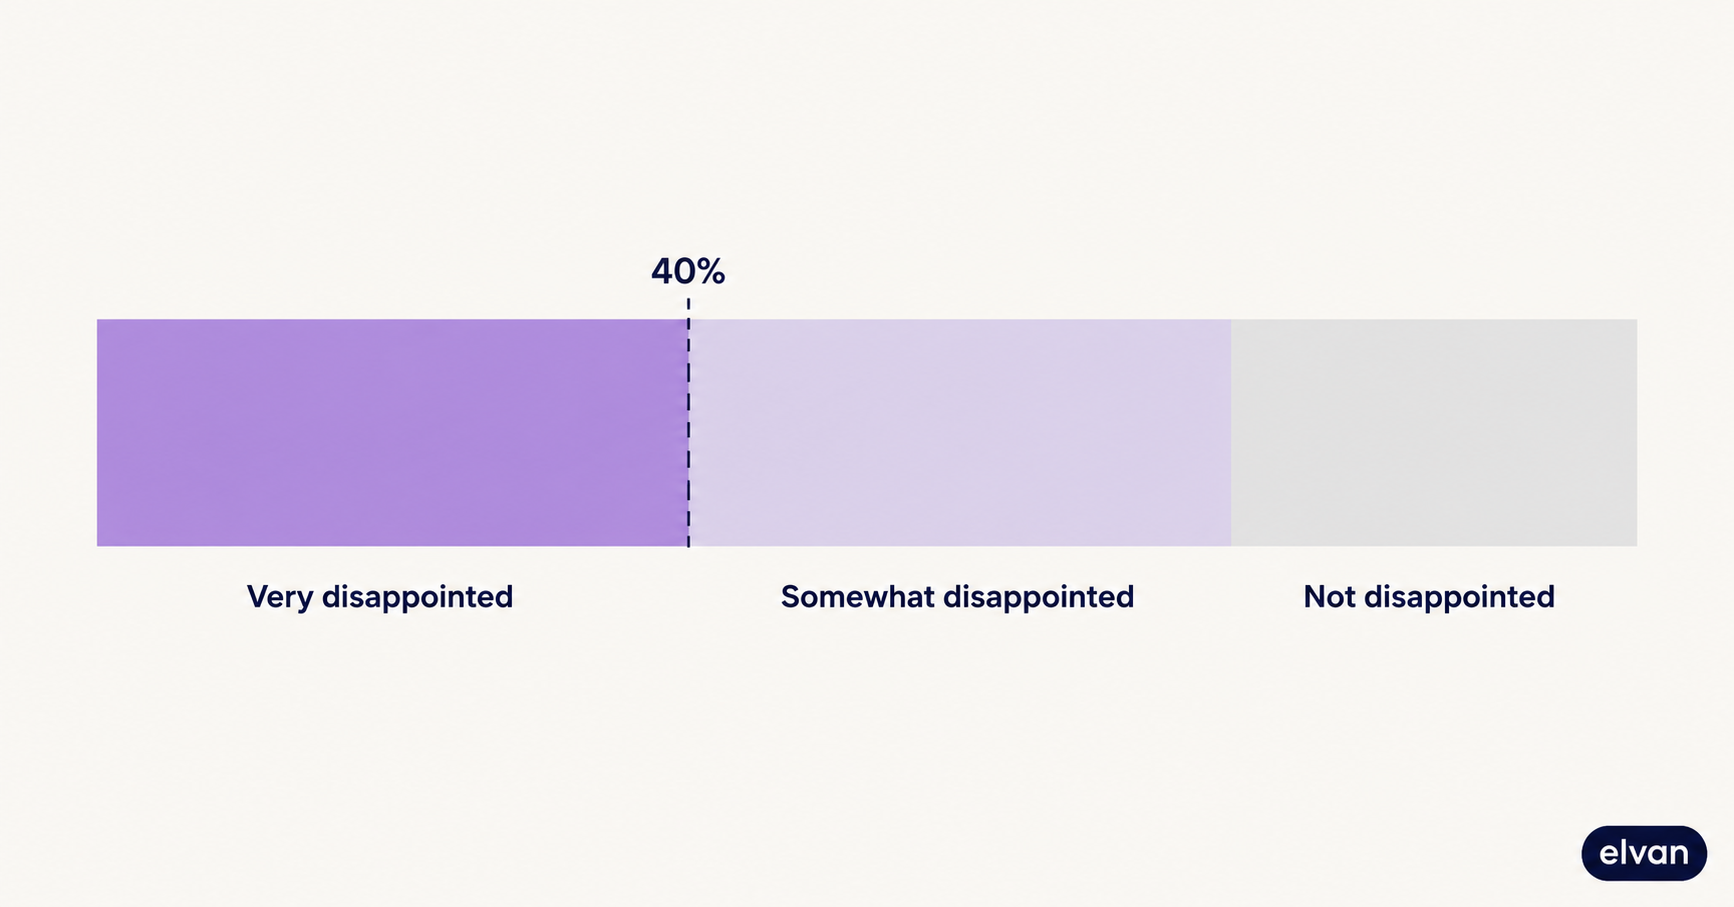
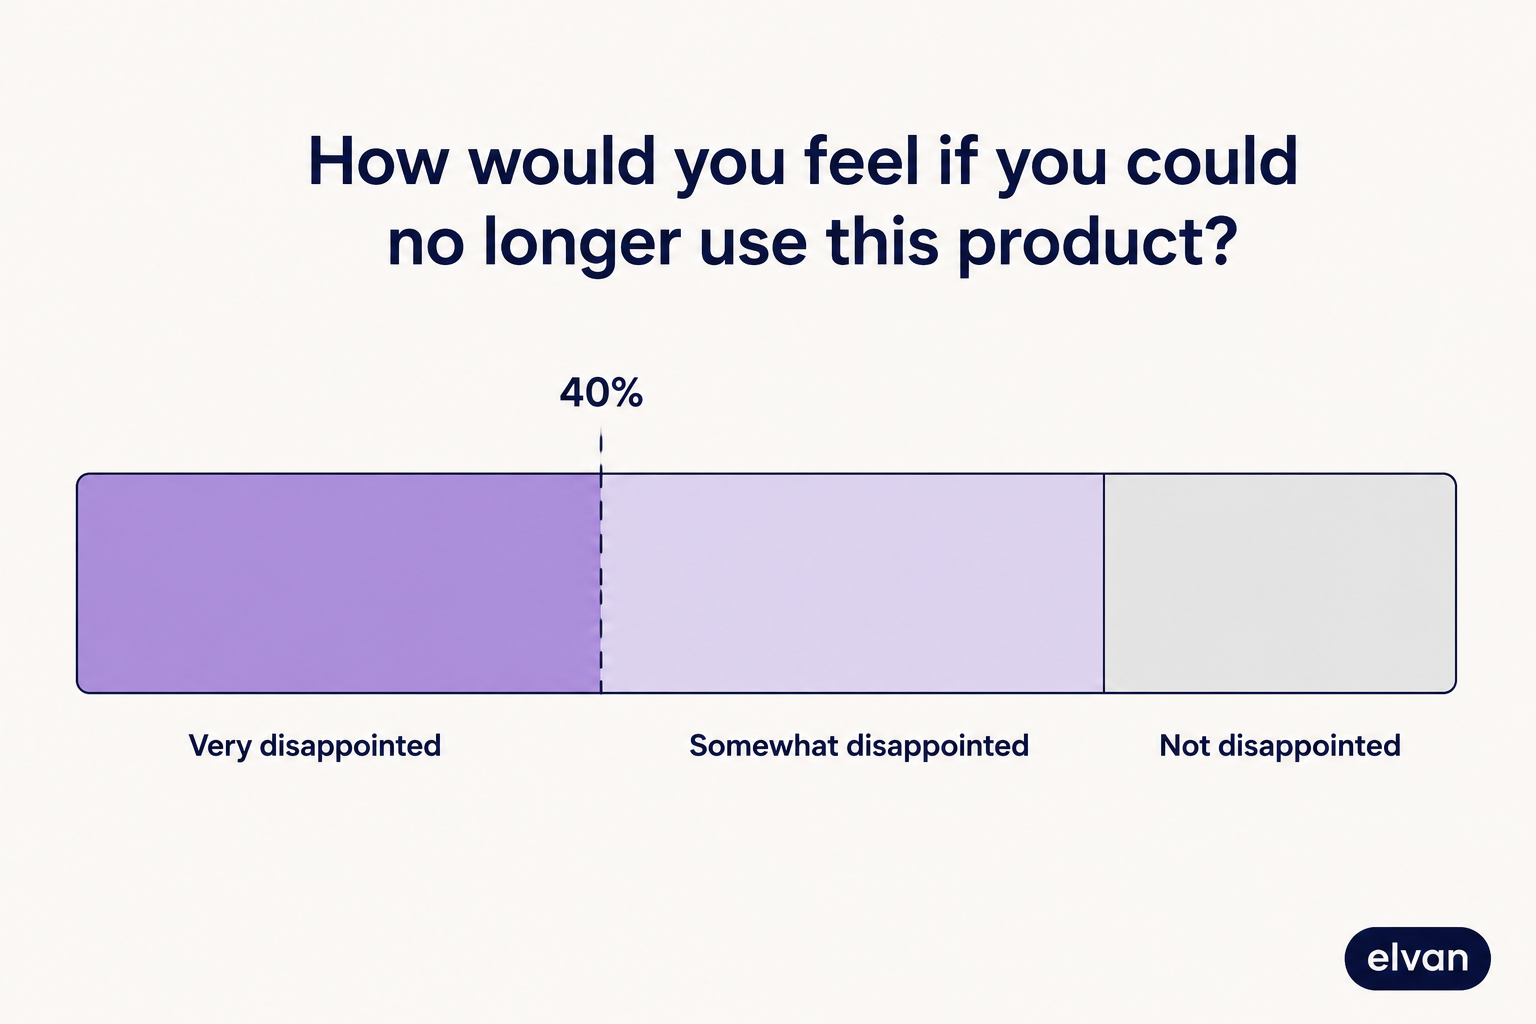
You measure product-market fit by asking your active users one question: how would you feel if you could no longer use this product? The options are very disappointed, somewhat disappointed, and not disappointed. If 40 percent or more say very disappointed, you have a widely cited signal of fit. This is the Sean Ellis test, and most teams that run it get a number that tells them almost nothing, because they run it wrong.
The test itself is not the problem. What most teams do with it is.
The three mistakes that make the 40% number meaningless
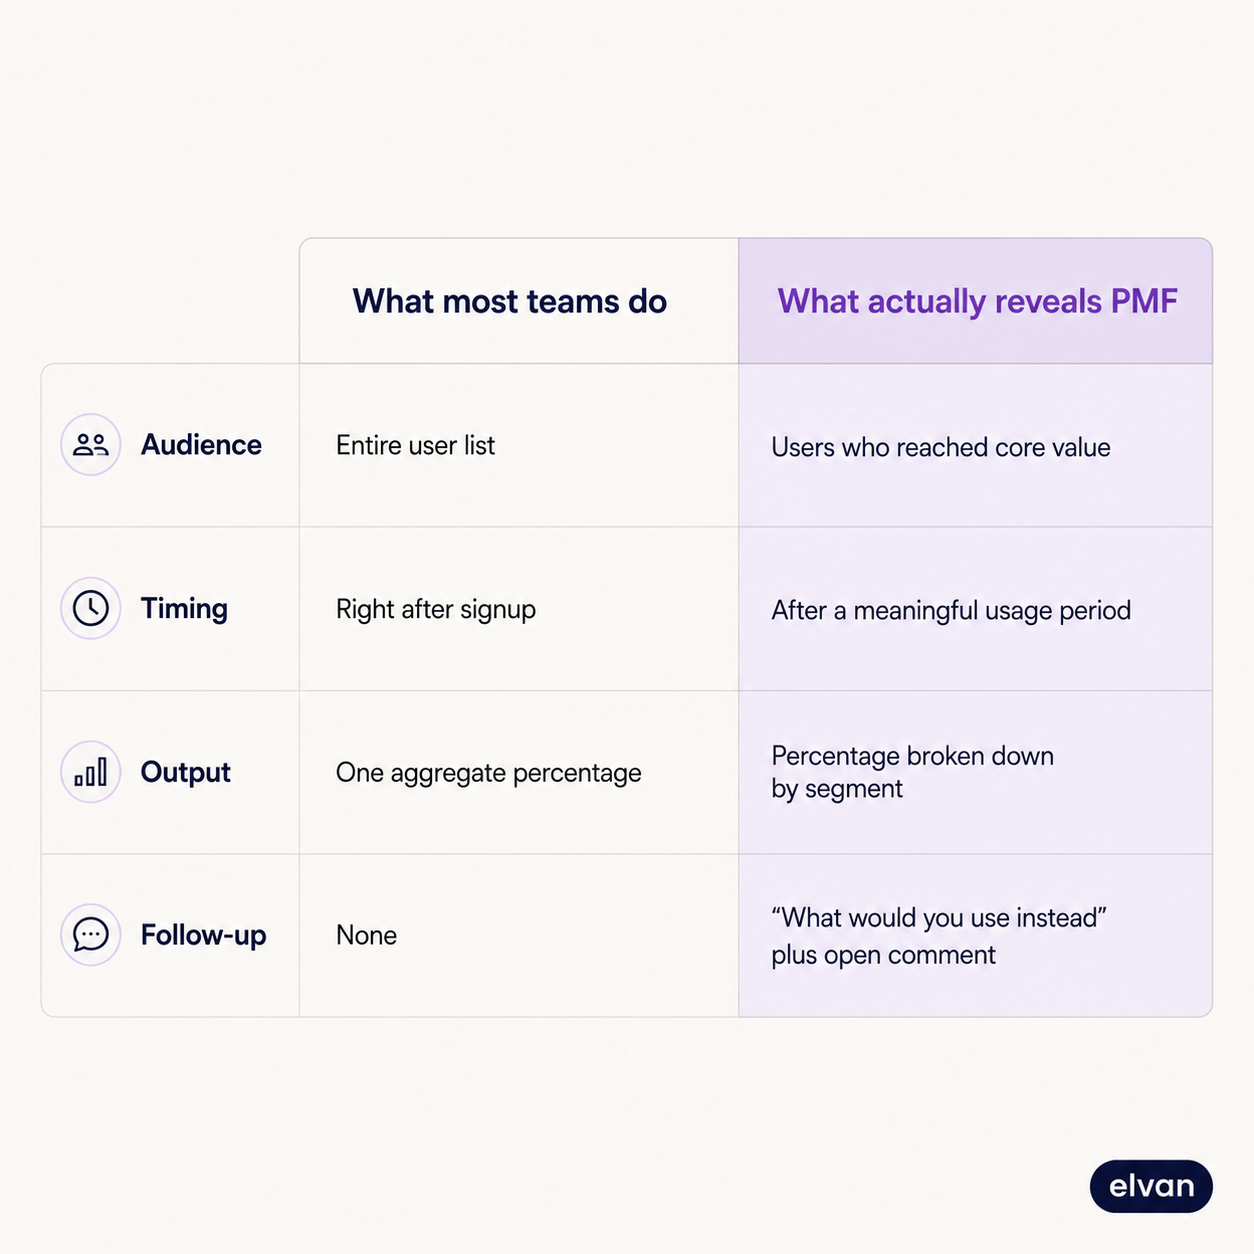
Surveying everyone instead of engaged users. The test was designed for people who have actually experienced the product's core value, not everyone who ever signed up. Send it to your full user list, including people who signed up once and never returned, and you dilute the result toward noise. A trial user who opened your app twice has no informed opinion about whether they would miss it. Their answer is not data, it is a coin flip.
Asking too early. If someone has not reached the moment your product actually delivers value, whatever that moment is for your product, their answer measures curiosity, not fit. Ask before onboarding is complete and you are measuring first impressions, which is a different question with a different survey.
Treating one number as the finish line. Teams run the test once, get a percentage, and either celebrate or panic. The percentage without the follow-up question, what would you use instead, and without segmentation by user type, is a headline with no article behind it.
What the aggregate score hides
Here is the position worth taking plainly: a single aggregate PMF score is close to useless for an early-stage product, because it averages together user segments that plainly have different relationships with what you built.
A 25 percent aggregate score sounds like failure. Split by segment and it might reveal that one segment sits at 55 percent, well past the threshold, while a segment you never intended to serve well sits near zero and is dragging the average down. The first number tells you to panic. The second tells you exactly who to build for and who to stop chasing.
This is the actual value of the test: not the number itself, but the segmentation that explains it. Cut the response by acquisition channel, by company size, by how long they have used the product, by which feature they use most. Fit usually exists somewhere in your data well before it exists everywhere.
What most teams do vs what actually reveals fit
The difference between a PMF number that misleads you and one that guides you comes down to four choices: who you ask, when you ask, what you do with the output, and how often you repeat it.
The follow-up question that matters more than the score
If someone says they would be very disappointed to lose your product, ask what they would use instead. An answer like "nothing, I would go back to spreadsheets" describes a different category of fit than "I would probably switch to a competitor within a week." The first tells you that you are the only real option in the space you occupy. The second tells you that you are winning on convenience, not necessity, and a better-funded competitor could take that share.
The comment field on a not disappointed or somewhat disappointed answer is where you find the actual gap. A pattern of comments mentioning a missing integration or a specific workflow limitation is a roadmap, not just a feedback log.
Running this without waiting on a data team
The mechanics of a PMF survey are simple: one question, a three-option scale, an optional comment field, sent to users past a usage threshold you define, repeated on a schedule. The part that usually breaks is the segmentation, because most tools make you export to a spreadsheet to see the score by cohort instead of in aggregate.
Elvan runs PMF surveys alongside NPS, CSAT, CES, and eNPS, triggered after whatever usage threshold defines real engagement in your product, not on a blanket schedule to your full list. Segment breakdowns are available without an export, so the aggregate number and the cohort story sit side by side instead of requiring a second tool.
If you have never run this test cleanly, segmented and timed against real usage, the free tier covers 100 responses a month, enough to run your first properly targeted PMF wave.

Neil Roy
Content Strategist
Neil is a content strategist specializing in CSAT and NPS surveys, creating educational content that helps businesses understand and improve customer satisfaction. With 10+ years of experience, Neil writes insightful articles and develops content strategies that translate complex survey concepts into accessible, actionable guidance for organizations looking to enhance their customer relationships and business outcomes.