NPS, CSAT & eNPS Benchmarks by Industry (2026)
NPS, CSAT and eNPS Benchmarks by Industry (2026)
You ran your NPS survey. You got a 38. Your VP looks at the slide and asks the only question that matters: "Is that good?"
The honest answer: it depends entirely on your industry.
A 38 in B2B SaaS puts you comfortably above the median. A 38 in professional services means you are trailing the pack. A 38 in telecom is genuinely exceptional. Same number. Completely different strategic positions.
This post covers 2026 benchmark data across NPS, CSAT, and eNPS for 11 industries, sourced from CustomerGauge's B2B report, Forrester CX Index 2025, Hive HR's Q1 2025 dataset (500,000+ employee responses), and ACSI's 2024 to 2025 data. You will get the numbers and, more importantly, why they are what they are and what to do once you have a score to compare.
—————————————————————————————————————————
NPS Benchmarks by Industry (2025 Data)
Net Promoter Score is one question: "How likely are you to recommend us to a friend or colleague?" Scored on a 0 to 10 scale, with promoters (9 to 10) minus detractors (0 to 6), giving you a number between -100 and +100.
Score ranges at a glance:
- 50+ — Excellent
- 30 to 49 — Good
- 0 to 29 — Needs work
- Below 0 — Crisis territory
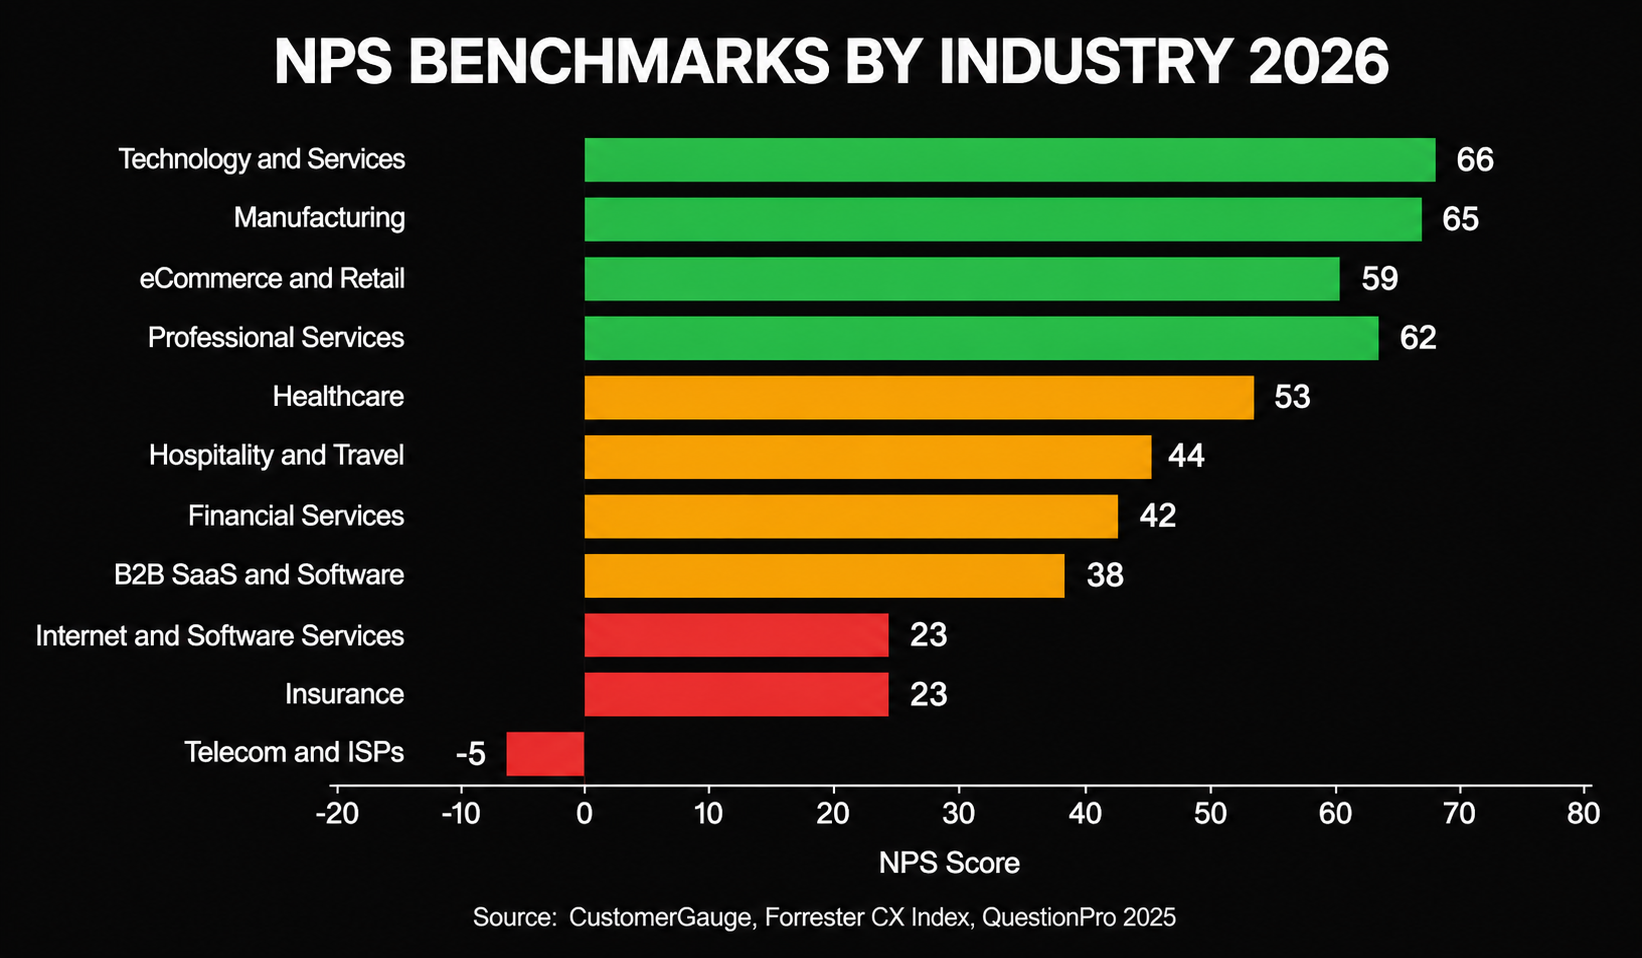
Here is where each industry sits, from strongest to weakest:
- Technology and Services — Median 66, top quartile 75+, up 5 points year over year
- Manufacturing — Median 65, top quartile 75+, stable
- eCommerce and Retail — Median 59, up 6 points
- Professional Services — Range 58 to 66, top performers above 70
- Healthcare — Median 53, top quartile above 65, up 7 points (biggest mover this year)
- Hospitality and Travel — Median 44, recovering
- Financial Services and Banking — Range 41 to 44
- B2B SaaS and Software — Range 36 to 41, top quartile above 55
- Internet and Software Services — Range 16 to 30, under downward pressure
- Insurance — Median 23, lowest non-telecom score
- Telecom and ISPs — Range -5 to 0, structurally negative
Sources: CustomerGauge 2025 B2B NPS Report, Forrester CX Index 2025, QuestionPro Q1 2025
Three Things the Raw Numbers Do Not Tell You
Telecom's negative NPS is structural, not a survey problem. High switching costs trap customers. They do not leave, but they are not happy about staying. Running better surveys will not change a market where competition is artificially constrained.
Healthcare's 7 point gain is the most interesting data point here. Post-pandemic investment in virtual care, patient portals, and digital-first intake reduced friction that historically made healthcare frustrating. When you remove friction instead of just asking people to be more patient, scores move.
NPS is declining globally and most teams think it is their own problem. Forrester's 2025 CX Index found drops in 20 of 39 industry-country pairs. Customer expectations have risen faster than companies can move. If your score held flat in 2024, you probably actually improved relative to your peer group. You just did not know it because you were watching the raw number instead of the trend.
The B2B vs B2C gap (38 vs 49 on average) is not a measurement error. B2C transactions are simpler and more emotional. B2B relationships involve multi-stakeholder complexity, longer onboarding, and expectations that rise every quarter after contract signing.
——————————————————————————————————————
CSAT Benchmarks by Industry (2025 Data)
CSAT measures satisfaction with a specific moment, a support ticket, a post-purchase experience, an onboarding call. Unlike NPS, which asks about overall loyalty, CSAT is transactional. That distinction is where most teams get into trouble.
The most common CSAT misread: a company can post an 82% CSAT and a 32 NPS at the same time. That is not a metrics glitch. It means customers are happy with individual interactions but would not recommend you overall. Something systemic is breaking the relationship even when individual touchpoints work fine.
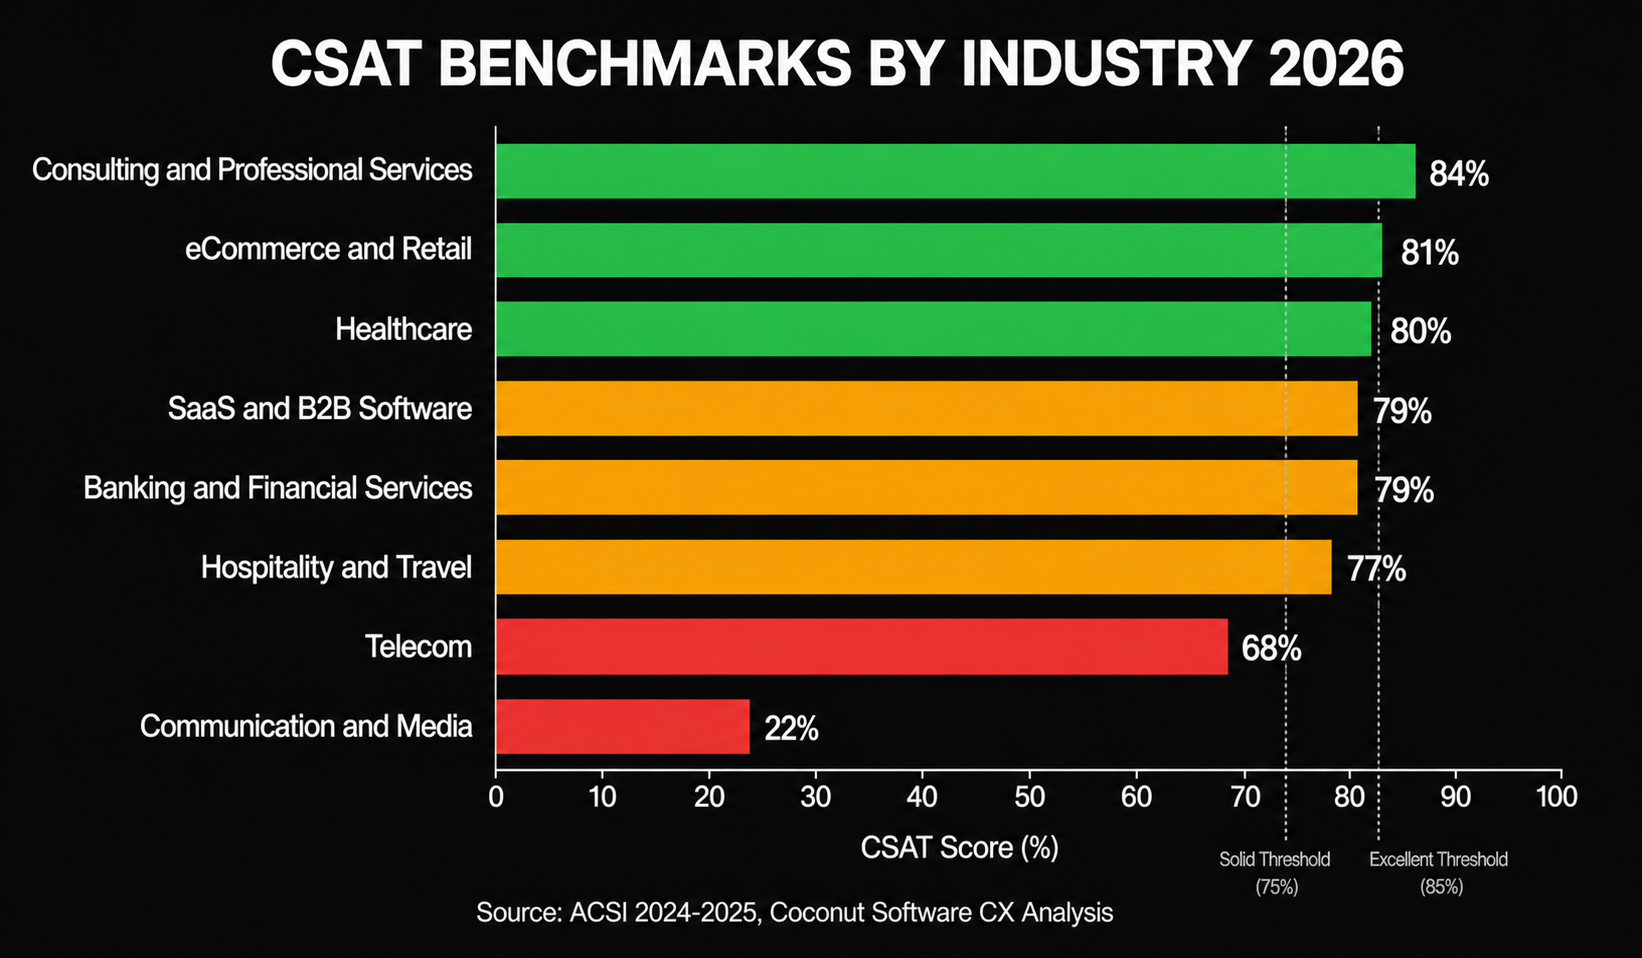
By industry:
- Consulting and Professional Services — 84%, driven by high-touch relationships
- eCommerce and Retail — 80 to 82%, moved by speed, easy returns, and responsive support
- Healthcare — Around 80%, boosted by virtual care adoption
- SaaS and B2B Software — 78 to 80%, where UX quality and support speed are the main levers
- Banking and Financial Services — 79%, improving but capped by security anxiety
- Hospitality and Travel — 76 to 78%, driven by personalization and flexibility
- Telecom — 68%, structurally low for the same reasons as its NPS
- Communication and Media — 22%, consistently the lowest tracked sector
Sources: ACSI 2024 to 2025 Annual Study, Coconut Software Banking CX Analysis
Rule of thumb most teams ignore:
- Above 85% — Excellent
- 75 to 85% — Solid
- Below 70% — A product or support crisis, not benchmark variance
Timing matters more than people admit. A CSAT survey sent five minutes after a support ticket closes scores measurably higher than the same survey sent 24 hours later. Trigger-based surveys consistently outperform scheduled ones by 8 to 15 percentage points.
——————————————————————————————————————
eNPS Benchmarks: The Metric Most Teams Underuse
eNPS applies the same NPS framework to your employees: "How likely are you to recommend working here to a friend?" Same scale, same math, completely different calibration.
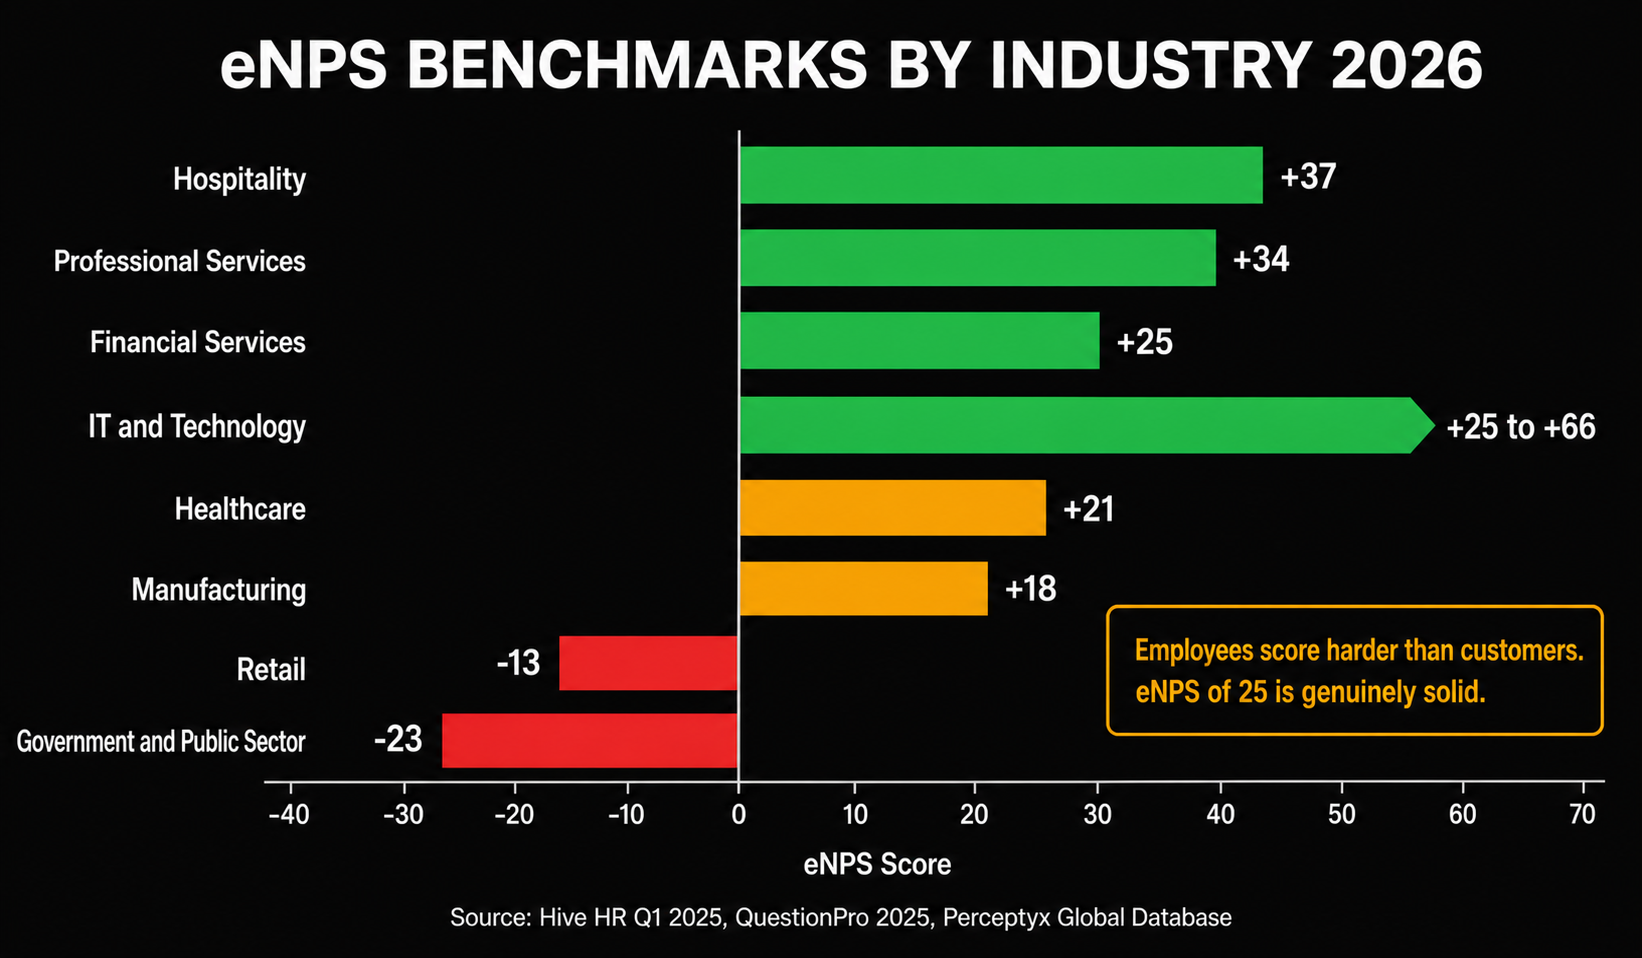
Employees score harder than customers. An eNPS of 25 is genuinely solid. Most organisations above 0 are doing better than average. Employees see the operational reality customers do not. Broken processes, management gaps, the distance between what leadership says and what actually happens.
The calibration most teams get wrong: a customer NPS of 25 is concerning. An eNPS of 25 is healthy. They use the same scale but have entirely different normative ranges.
By industry:
- Hospitality — 37, up 6 points, driven by wellness programs and flexible scheduling
- Professional Services — 33 to 35 and improving, autonomy and project variety as key drivers
- Financial Services — Around 25 and stable, supported by profit-sharing and career paths
- IT and Technology — Wide range of 25 to 66, startups vs large enterprise are genuinely different
- Healthcare — 21 to 22, stable, virtual care investment improving sentiment
- Manufacturing — 18 and improving, recognition programs making a measurable difference
- Retail — -13 and declining, hurt by scheduling rigidity and burnout
- Government and Public Sector — -23, lowest tracked sector by a significant margin
Sources: Hive HR Q1 2025 (500,000+ responses), QuestionPro 2025 eNPS Study, Perceptyx Global Database (20M+ employees)
The company size split is the most underreported finding in this data. Companies under 250 employees average eNPS 30. Organisations over 5,000 average 9. That 21 point gap is not a coincidence. At scale, visibility degrades, management layers multiply, and the gap between what leadership intends and what frontline employees experience becomes structurally harder to close.
Salesforce sits at 48 against a tech industry average of 25. The commonly cited explanation is compensation. The real drivers are genuine remote and hybrid flexibility and unusually high career visibility. Employees notice the gap between what you say and what you do faster than customers do.
——————————————————————————————————————
How to Actually Use Benchmark Data Without Fooling Yourself
Never Compare Across Industries
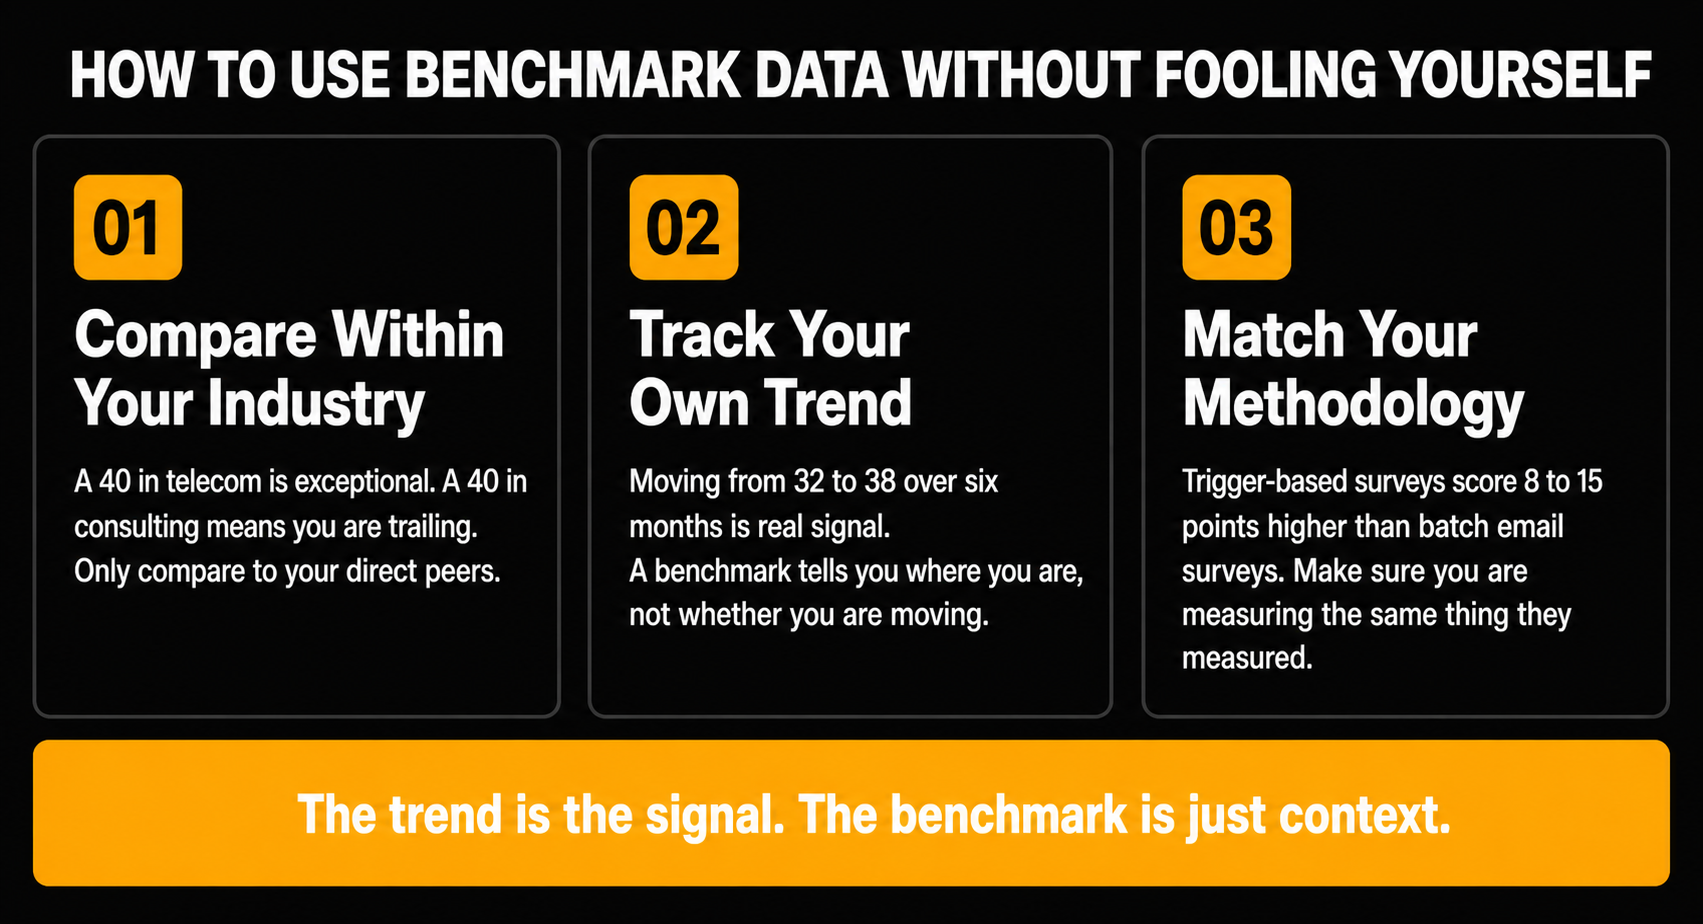
A 40 in telecom is exceptional. A 40 in consulting means you are trailing the median. The only comparison that produces actionable conclusions is within your direct competitive set. If you cannot find that data, your internal trend is more valuable than any external number.
Your Internal Trend Outperforms Any External Benchmark
Moving from +32 to +38 over six months tells you something real. Something changed, something worked, something is directionally right. A benchmark chart tells you where you are, not whether you are moving. The trend is the signal. The benchmark is just context.
Survey Methodology Matters More Than the Score
A post-purchase CSAT survey sent five minutes after delivery scores higher than the same survey batch-emailed three days later. Before you compare your number to an industry benchmark, ask: are you measuring the same thing they measured? Methodology differences create score differences that have nothing to do with actual customer sentiment.
The uncomfortable truth most benchmark posts avoid: most NPS programs over-measure happy customers. You are emailing surveys to people who open your emails, which skews toward engaged users. Your detractors already churned and stopped opening. In-product triggering gets closer to the truth. Batch email surveys get you a flattering version of it.
Start Measuring. Compare to Something Real.
Benchmarks are only useful once you have a score to compare.
If you are not measuring yet, or if your current tool is going away, Elvan runs NPS, CSAT, CES, and eNPS surveys in under 20 minutes. Free to start, no credit card required. Pro is $49 per month with AI-powered summaries that turn response data into plain-English insights your leadership team can actually use.
Migrating from another tool? We handle it personally: elvan.ai/delighted-alternative

Neil Roy
Content Strategist
Neil is a content strategist specializing in CSAT and NPS surveys, creating educational content that helps businesses understand and improve customer satisfaction. With 10+ years of experience, Neil writes insightful articles and develops content strategies that translate complex survey concepts into accessible, actionable guidance for organizations looking to enhance their customer relationships and business outcomes.