
How to Calculate NPS: The Formula, a Worked Example, and the Mistake Almost Everyone Makes
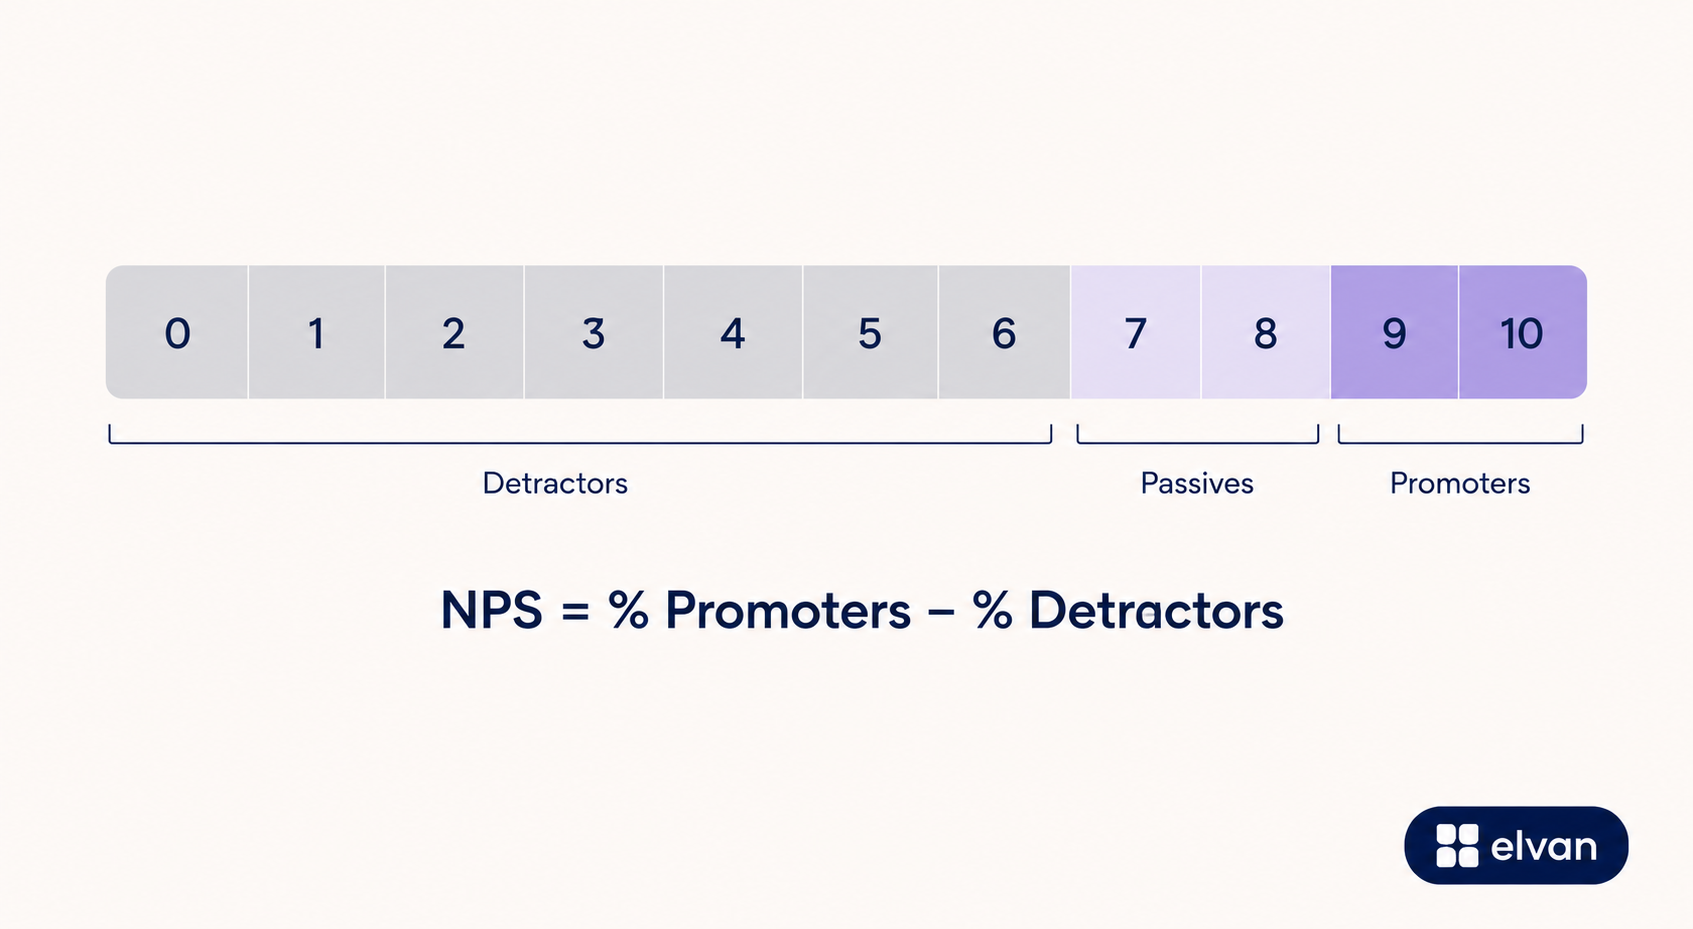
NPS is calculated by subtracting the percentage of detractors from the percentage of promoters. That is the entire formula:
NPS = % Promoters − % Detractors
Promoters are respondents who scored you 9 or 10. Detractors scored 0 through 6. Passives scored 7 or 8 and are excluded from the calculation, though they still count in your total respondent number. The result is a score between −100 and +100, and it is written as a whole number, not a percentage.
If you want the answer without the arithmetic, our free calculator does it instantly: elvan.ai/nps-calculator. The rest of this article covers the worked example, the edge cases that trip teams up, and the one mistake that makes most NPS numbers meaningless.
A worked example
Say you surveyed 250 customers and got these responses:
Scores 9 to 10: 110 people. Scores 7 to 8: 85 people. Scores 0 to 6: 55 people.
Promoters: 110 ÷ 250 = 44 percent. Detractors: 55 ÷ 250 = 22 percent.
NPS = 44 − 22 = 22.
Notice the passives. They did not appear in the subtraction, but they were in the denominator. This matters. A team that quietly drops passives from the total inflates both percentages and gets a different, wrong number. All respondents go in the denominator. Only promoters and detractors go in the subtraction.
Edge cases that produce wrong scores
A score of 7 or 8 is not good news. Teams routinely read passives as mild promoters. They are not. Passives churn at meaningfully higher rates than promoters and they do not refer anyone. The formula excludes them from the score precisely because their behavior is unpredictable. If your survey volume is dominated by 7s and 8s, your NPS can look respectable while your renewal risk quietly grows.
Small samples produce fake precision. An NPS of 40 from 25 responses is not a real 40. One person changing their answer moves the score by 4 to 8 points. As a working rule, treat any score from fewer than 100 responses as directional. Report the trend, not the number.
Negative scores are normal early on. If you survey a broad customer base for the first time, especially by email, you often hear from frustrated customers first. A first-wave score of −10 is information, not a crisis. The second and third waves tell you whether it is real.
Rounding conventions change the score. 44.4 percent promoters minus 22.6 percent detractors is 21.8. Some teams report 22, some report 21. Pick one convention and never change it, because a one-point wobble from rounding will otherwise get read as a trend.
The mistake that makes most NPS numbers meaningless
Here is the opinion part, and it is the reason we bothered writing another NPS article in a category that has hundreds of them.
The calculation is trivial. Any spreadsheet can do it. The mistake that actually ruins NPS programs happens before the calculation: surveying the wrong people at the wrong time and then computing a precise score from a biased sample.
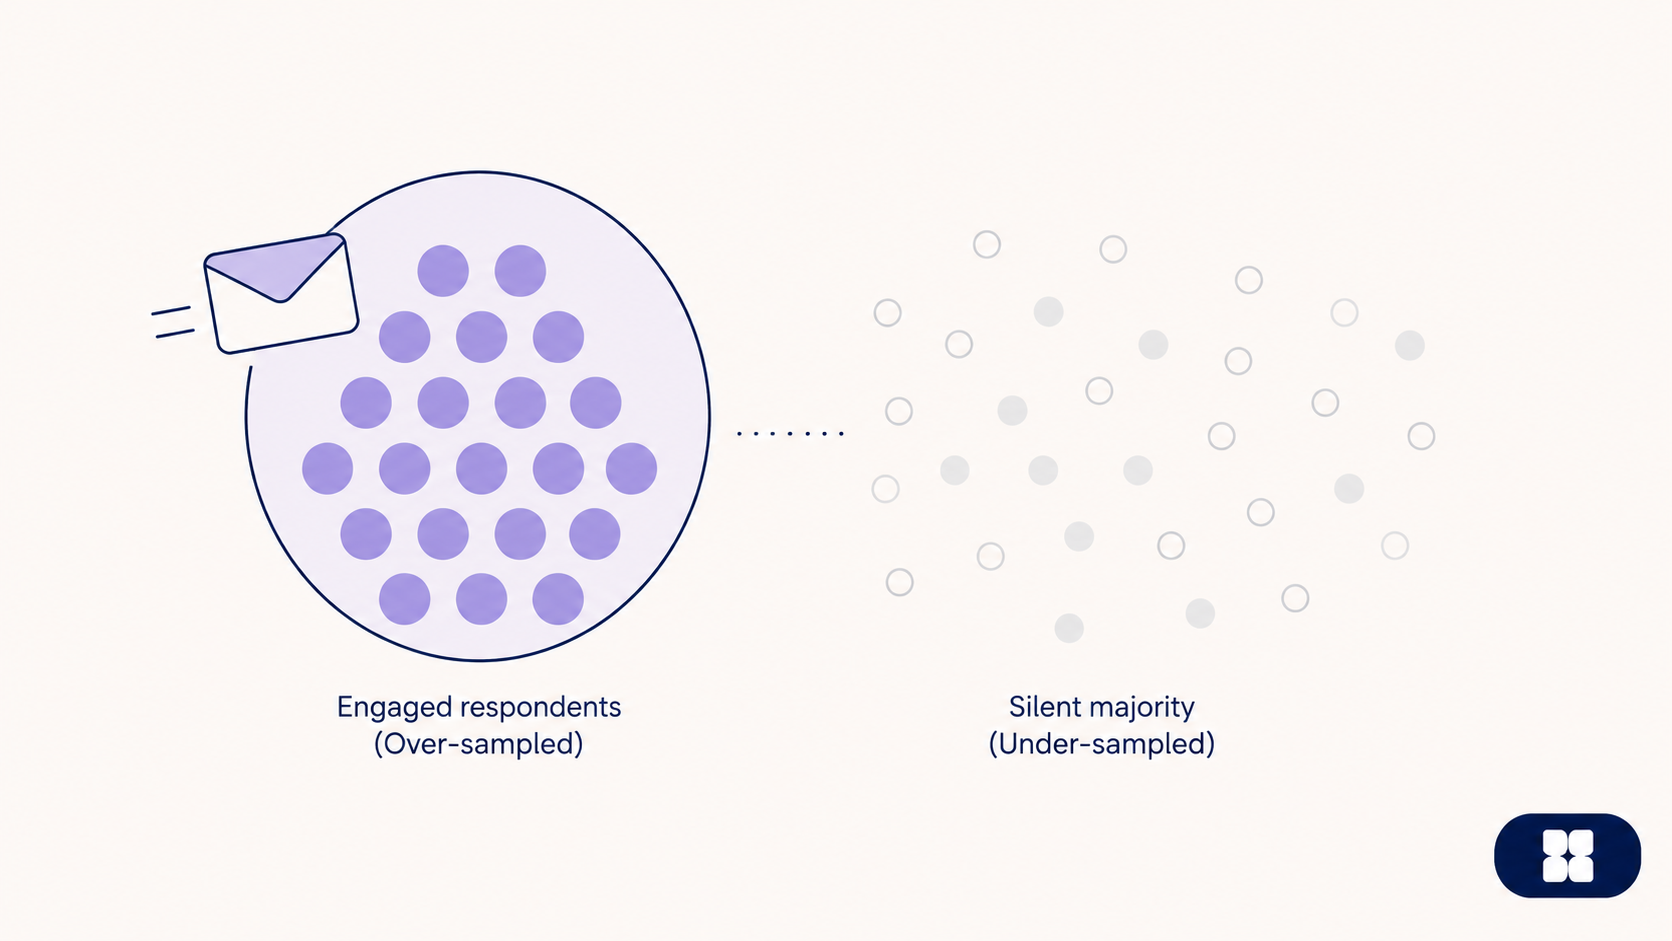
Email-based NPS goes to the customers who still open your emails. That is your most engaged cohort, the people already most likely to stay. The customers drifting toward churn stopped reading your emails months ago. They are absent from your sample, so your score reads higher than your actual customer sentiment, and it stays flat right up until the renewals do not come.
The fix is not a better formula. It is a better trigger. Survey inside the product, after real interactions, and your sample starts to include the quiet middle of your customer base instead of just the fans. The score usually drops when teams make this change. That drop is the score becoming true.
So calculate NPS correctly, but spend your real effort on who gets asked and when. A perfectly computed score from a biased sample is a precise measurement of the wrong thing.
Segment before you react
One aggregate NPS hides everything useful. The number becomes operational when you cut it:
By plan or spend tier, because a detractor on your biggest plan is a different emergency than one on the free tier. By tenure, because new-customer NPS measures onboarding while old-customer NPS measures the product. By surface, because post-support NPS and in-product NPS answer different questions and averaging them answers neither.
If your tool cannot segment scores without exporting to a spreadsheet, the calculation was the easy part and the tool is failing you at the hard part.
Where Elvan fits
Elvan computes NPS automatically as responses arrive and segments it without exports. Surveys trigger from real events, in-product through the Web SDK, from closed Zendesk tickets, by link or embed, so the sample includes the customers a batch email would miss. The AI Insights feature then turns the open-text comments into a plain-English summary, which is where the actual reasons behind the score live.
The free tier includes 100 responses a month. Enough to run your first properly triggered NPS wave and see what your score looks like when the sample is honest.
And if you just need the arithmetic right now, the calculator is free, no signup:

Neil Roy
Content Strategist
Neil is a content strategist specializing in CSAT and NPS surveys, creating educational content that helps businesses understand and improve customer satisfaction. With 10+ years of experience, Neil writes insightful articles and develops content strategies that translate complex survey concepts into accessible, actionable guidance for organizations looking to enhance their customer relationships and business outcomes.