

What Is a Good Survey Response Rate? Benchmarks by Channel and Why Timing Beats Everything
A good survey response rate depends almost entirely on the channel. For email surveys, 5 to 15 percent is typical and anything above 20 percent is strong. For in-product surveys triggered after a specific action, 20 to 40 percent is common. For post-support CSAT surveys sent the moment a ticket closes, well-run teams see 30 percent or higher.
If you came here with a single number in mind, use this one: 10 percent for email, 30 percent for triggered in-product surveys. Below those, something in your setup is wrong. Above those, you are doing better than most.
Now the part most benchmark articles skip. The channel numbers above are not really about channels. They are about timing. And once you see that, your response rate stops being a mystery.
Response rate benchmarks by channel
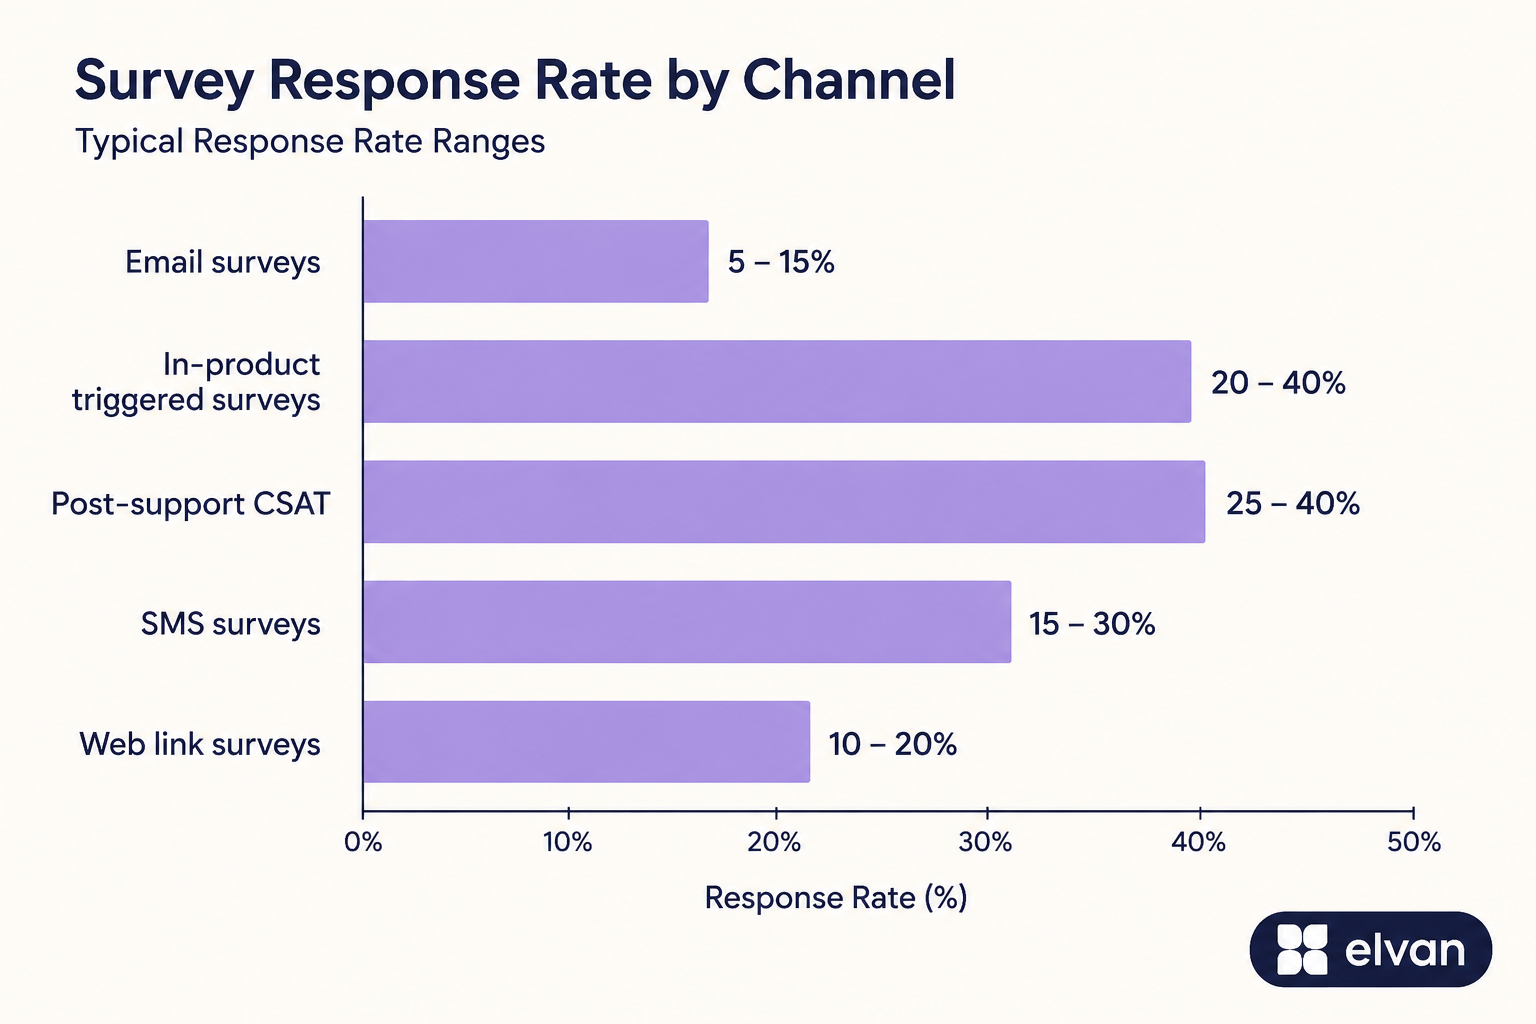
A few notes on reading these ranges honestly.
Email sits at the bottom not because email is a bad channel, but because most email surveys arrive days after the experience they ask about. The customer has moved on. The survey is an interruption, not a continuation.
In-product surveys sit at the top because they fire while the experience is still happening. Someone who just completed onboarding, exported their first report, or closed a support ticket is still in context. Answering takes five seconds and feels relevant.
SMS response rates look impressive in vendor marketing, but they degrade fast if you overuse the channel. People tolerate one text survey. They resent three.
The variable that actually moves response rates
Most advice about improving response rates focuses on cosmetics. Shorter surveys. Better subject lines. Mobile-friendly design. All of that helps at the margins.
The variable that moves response rates by multiples, not percentage points, is the gap between the experience and the ask.
We see this constantly in our own data at Elvan. Surveys triggered by an event, a closed ticket, a completed purchase, a feature used for the first time, consistently outperform surveys sent on a calendar schedule to the same audience. The survey content is identical. The audience is identical. The only difference is that one arrives inside the moment and the other arrives after it.
This is also why quarterly batch NPS campaigns produce the response rates that make CX teams despair. You are asking hundreds of people to recall an average feeling about months of interactions. The engaged customers reply. The quiet majority, including the ones drifting toward churn, ignore it. Your response rate is low and your sample is biased in the same direction, toward people who already like you.
What a low response rate is telling you
A response rate under 5 percent on email, or under 15 percent in-product, is a symptom. Here is the usual diagnostic order.
First, check timing. How long after the experience does the survey arrive? If the answer is measured in days, fix that before touching anything else. Move to event-based triggers.
Second, check length. One question with an optional comment field will outperform a ten-question form every time. If you need ten answers, you need three surveys, not one long one.
Third, check the sender. Surveys from a recognizable product or a real person outperform surveys from a generic noreply address. We learned this the hard way in our own outbound: the same message from a real founder's address performed dramatically better than from an anonymous alias.
Fourth, check frequency. Survey fatigue is real. If the same customer gets surveyed monthly, response rates decay with each wave. Throttle per-customer frequency and the rate recovers.
How to measure it properly
Response rate is completed responses divided by delivered surveys. Two common mistakes inflate or deflate the number.
Counting sends instead of deliveries overstates your denominator. Bounced emails never had a chance to respond. Use delivered.
Counting partial responses as completes overstates your numerator. Someone who clicked the NPS score but abandoned the comment field is a partial. Decide which you count and stay consistent, because a benchmark is only useful if you measure the same way every month.
Track the rate by segment, not just in aggregate. A blended 12 percent might hide a 30 percent rate from active users and 2 percent from dormant ones, which are two completely different stories requiring two different responses.
Where Elvan fits
Everything above is the reason we built Elvan around triggers instead of schedules. Surveys fire from events: a Zendesk ticket closing, an action inside your product through the Web SDK, a link at the exact step of a flow where the experience just happened. NPS, CSAT, CES, and the rest, sent inside the moment instead of after it.
The AI Insights layer then summarizes responses in plain English, so a low-volume, high-relevance survey program still produces something you can walk into a meeting with.
The free tier covers 100 responses a month, which is enough to test whether triggered timing changes your response rate the way it changed ours. Setup takes under 20 minutes.
Start measuring what your customers actually think, at the moment they actually think it.
elvan.ai/nps-software

Neil Roy
Content Strategist
Neil is a content strategist specializing in CSAT and NPS surveys, creating educational content that helps businesses understand and improve customer satisfaction. With 10+ years of experience, Neil writes insightful articles and develops content strategies that translate complex survey concepts into accessible, actionable guidance for organizations looking to enhance their customer relationships and business outcomes.