

Why Your CSAT Score Looks Great and Your Retention Doesn'tz`
Your CSAT score and your retention rate can both be accurate and still tell you completely different stories, because CSAT was never built to measure the thing retention actually depends on. CSAT measures whether a specific interaction went well. Retention measures whether the relationship, across every interaction and every unmet expectation between them, was worth continuing. A team can win every single interaction and still lose the relationship.
This is not a flaw in CSAT. It is a scope problem, and most teams treat the two metrics as if they are supposed to move together.
What CSAT actually asks
A CSAT question is almost always tied to a moment: how satisfied were you with this support interaction, this onboarding call, this checkout experience. The scale is short, usually one to five, and the response window is immediate. That immediacy is CSAT's strength. It tells you, with high response rates, whether the thing that just happened was handled well.
It also means CSAT has a short memory. A customer can rate a support interaction a 5 because the agent was fast, polite, and solved the immediate problem, while still being frustrated that the underlying issue has recurred three times this year. The interaction was excellent. The relationship is fraying. CSAT only sees the first part.
Why the two metrics diverge in practice
Retention is the sum of every interaction, every price increase, every competitor's better feature launch, and every unmet expectation a customer has accumulated, whether or not any single one of those things ever generated a survey. CSAT samples a narrow slice of that experience, the parts that happen to be interaction-shaped and get surveyed. Everything else, the slow accumulation of "this is fine but I keep noticing better options," never shows up in a CSAT number because there was never a discrete interaction to rate.
Support-heavy products are especially prone to this gap. A customer who contacts support five times a year and rates every ticket a 5 looks, on paper, like your happiest segment. In reality, five support contacts a year for the same recurring issue is itself the retention risk. CSAT is measuring how well you handled the fire. It is not measuring why the fire keeps starting.
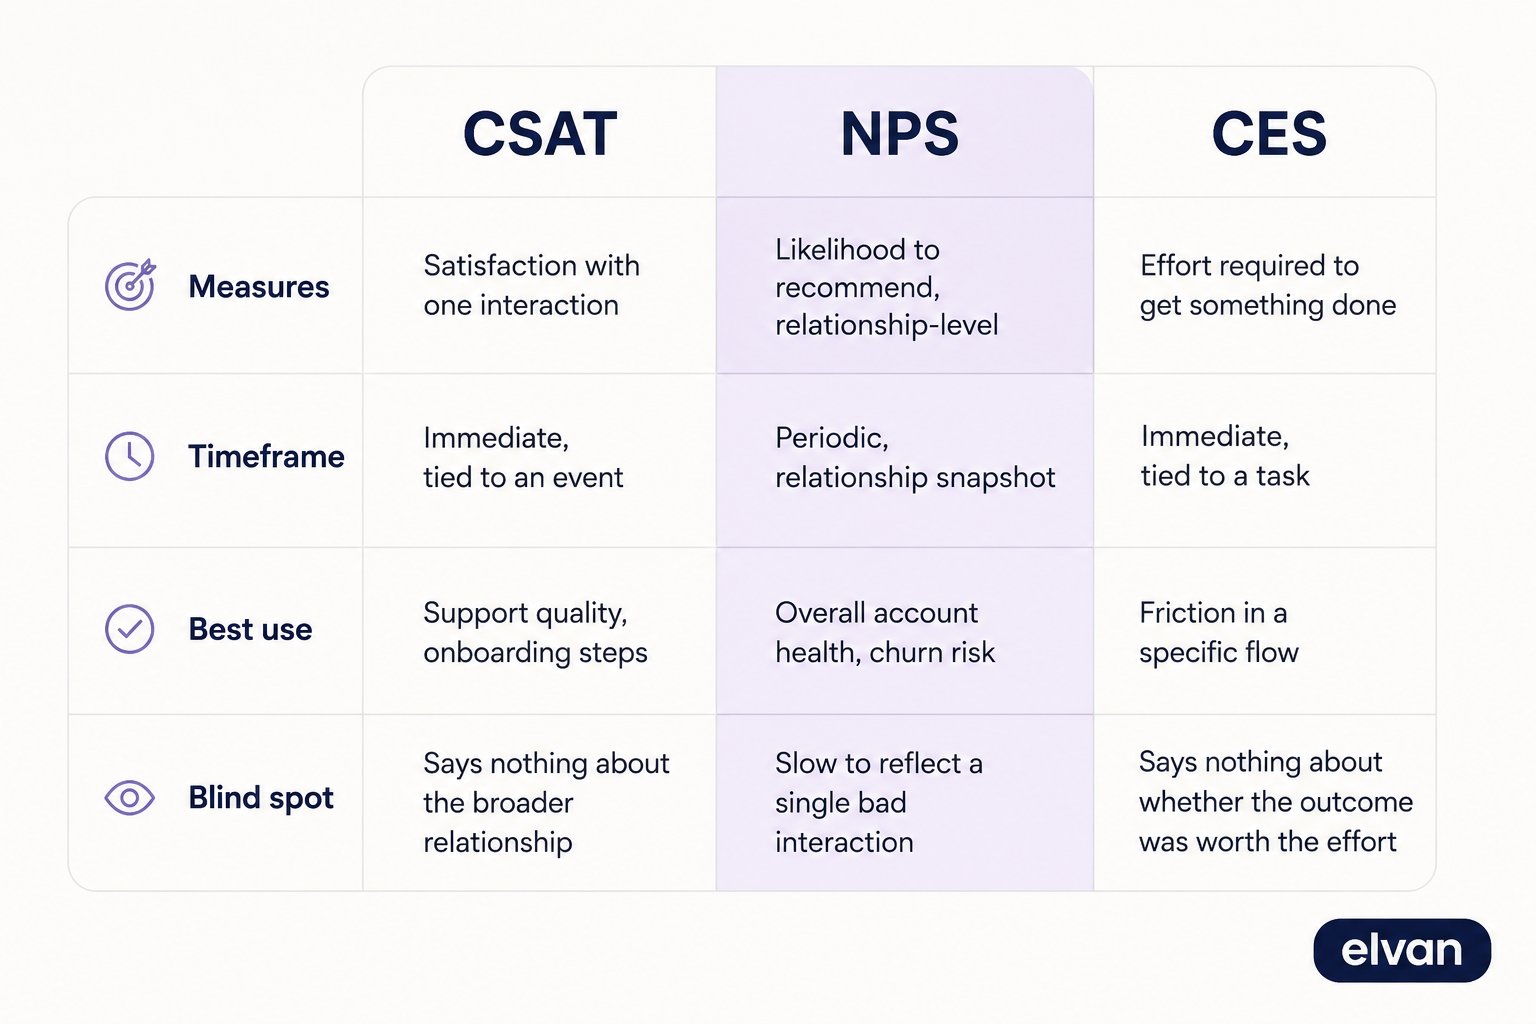
What each metric actually measures
CSAT, NPS, and CES are not interchangeable, and the mistake most teams make is picking one and expecting it to explain retention on its own.
None of these three is wrong. Each answers a narrower question than teams usually assume it does.
What to actually do about the gap
Stop expecting CSAT to explain churn on its own. Pair it with a relationship-level metric like NPS, run periodically rather than per-interaction, and watch the two together. A steady CSAT alongside a declining NPS is the clearest available signal that something structural is wrong even though every individual interaction is being handled fine.
Look at CSAT volume, not just score. A customer submitting five CSAT surveys a quarter for recurring issues is telling you something a single high score cannot. Track repeat-contact rate alongside the satisfaction score, not instead of it.
Read the comments, not just the number. The score tells you the interaction went fine. The open-text field is where a customer mentions that this is the third time this month, or that they are only still using the product because switching is a hassle right now. That sentence is the actual retention risk, and it will never show up in the numeric average.
Where Elvan fits
Elvan runs CSAT alongside NPS, CES, eNPS, and PMF from the same account, so you are not stitching together two tools to see the full picture. The AI Insights feature summarizes open-text comments across all your survey types in plain English, which is where the gap between "the interaction went well" and "the relationship is at risk" usually becomes visible before it shows up in a churn report.
If CSAT has been telling you everything is fine and retention disagrees, the disagreement is not a data error. It is two metrics doing their job correctly and answering two different questions.

Neil Roy
Content Strategist
Neil is a content strategist specializing in CSAT and NPS surveys, creating educational content that helps businesses understand and improve customer satisfaction. With 10+ years of experience, Neil writes insightful articles and develops content strategies that translate complex survey concepts into accessible, actionable guidance for organizations looking to enhance their customer relationships and business outcomes.